

DEFINITION:
“The ratio of the volume of put options traded to the volume of call options traded, which is used as an indicator sentiment (bullish or bearish).”
Put-call ratio (PCR) is an indicator that forecast the trend of the INDEX/STOCKS.
A “Put” or put option is a right to sell an asset at a predetermined price. A “Call” or call option is right to buy an asset at a predetermined price. Many traders use options for directional beta; buying call when market bullish & buying put when market bearish.
PCR is a popular derivative indicator, specifically designed to help traders gauges the overall sentiment of the market. The ratio is calculated either on the basis of options trading volumes or on the basis of the open interest for a particular period.
This indicator will show you which gang is dominating the market; the bearish gang (short masters), or the bullish gang (long masters).
The put call ratio can be calculated for any individual stock, as well as for any INDEX, or can be aggregated.
HOW TO ANALYSES PCR:
The put call ratio is calculated by the dividing the number of OPEN INEREST of put option by the number of OPEN INEREST of call option.
PCR (OI) = PUT OPEN INTEREST ON GIVEN DAY/ CALL OPEN INTEREST ON SAME DAY:
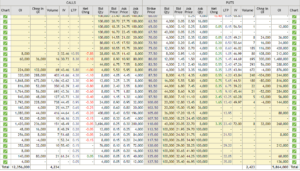
PCR for marker wide position can be also be calculated by taking total number of OI for all OI call options & for all OI options in a given series.The PCR can be calculated for indices, indivu
Eg.
PUT (OI) CALL (OI)
CURRENT MONTH CURRENT MONTH
NEXT MONTH NEXT MONTH
FAR MONTH FAR MONTH
PCR = PUT (OI)/ CALL (OI)
PCR = ?
- A rising put-call ratio, or a ratio greater than .7 or exceeding 1, means that equity traders are buying more puts than calls. It suggests that bearish sentiment is building in the market. Investors are either speculating that the market will move lower or are hedging their portfolios in case there is a sell-off.
- A falling put-call ratio, or below .7 and approaching .5, is considered a bullish indicator. It means more calls are being bought versus puts.
Also Read | What is Index?

