When a stock forms a pattern with volume, it indicates significant market activity, whether it’s accumulation or a potential breakout. Jumping in without proper analysis can be risky, which is why fundamental analysis plays a crucial role.
Step-by-Step Approach:
1️⃣ Identify the Pattern First
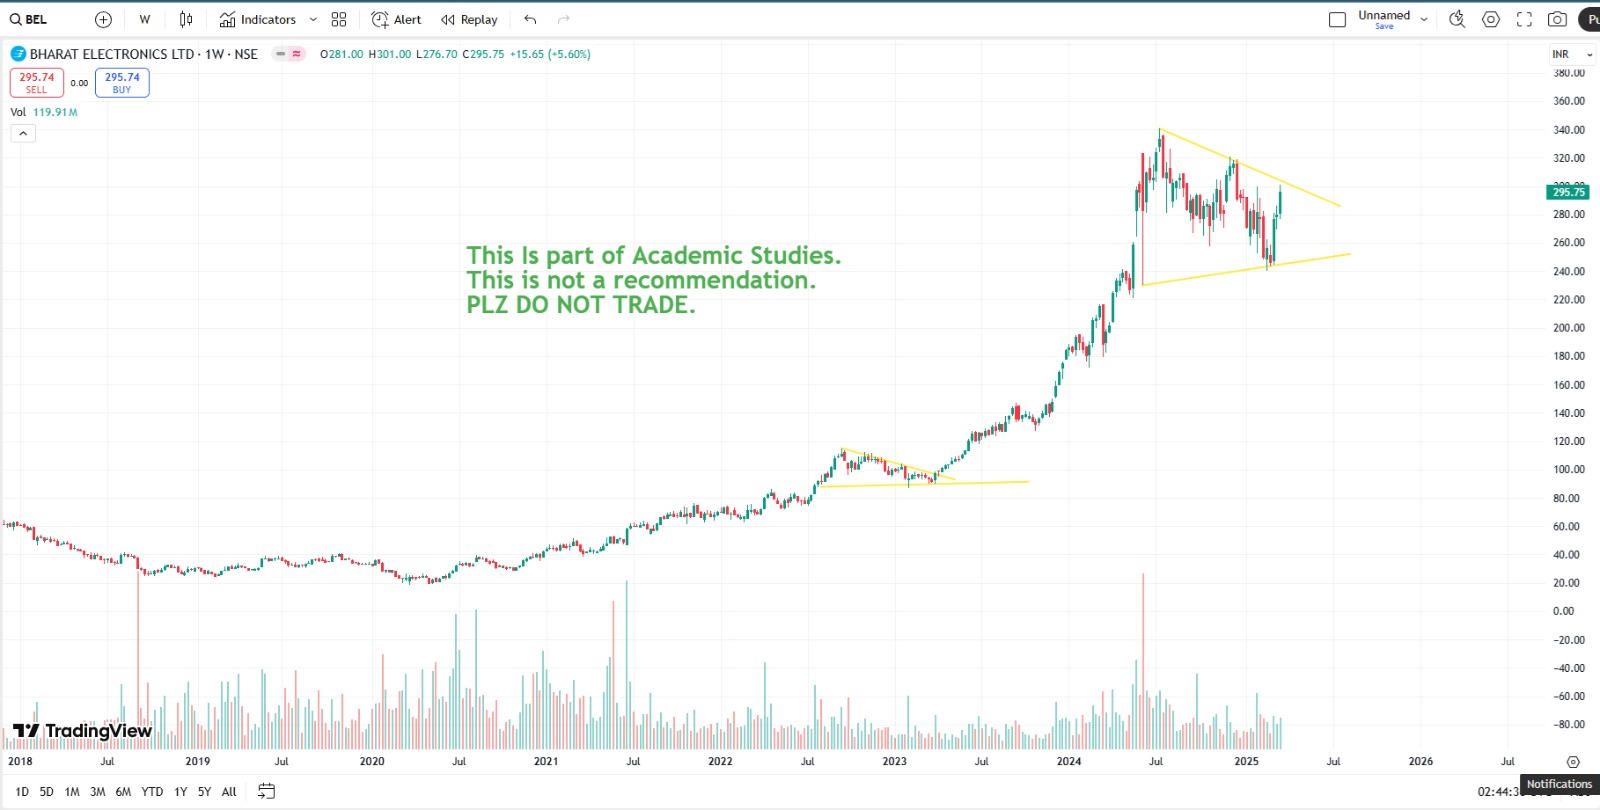
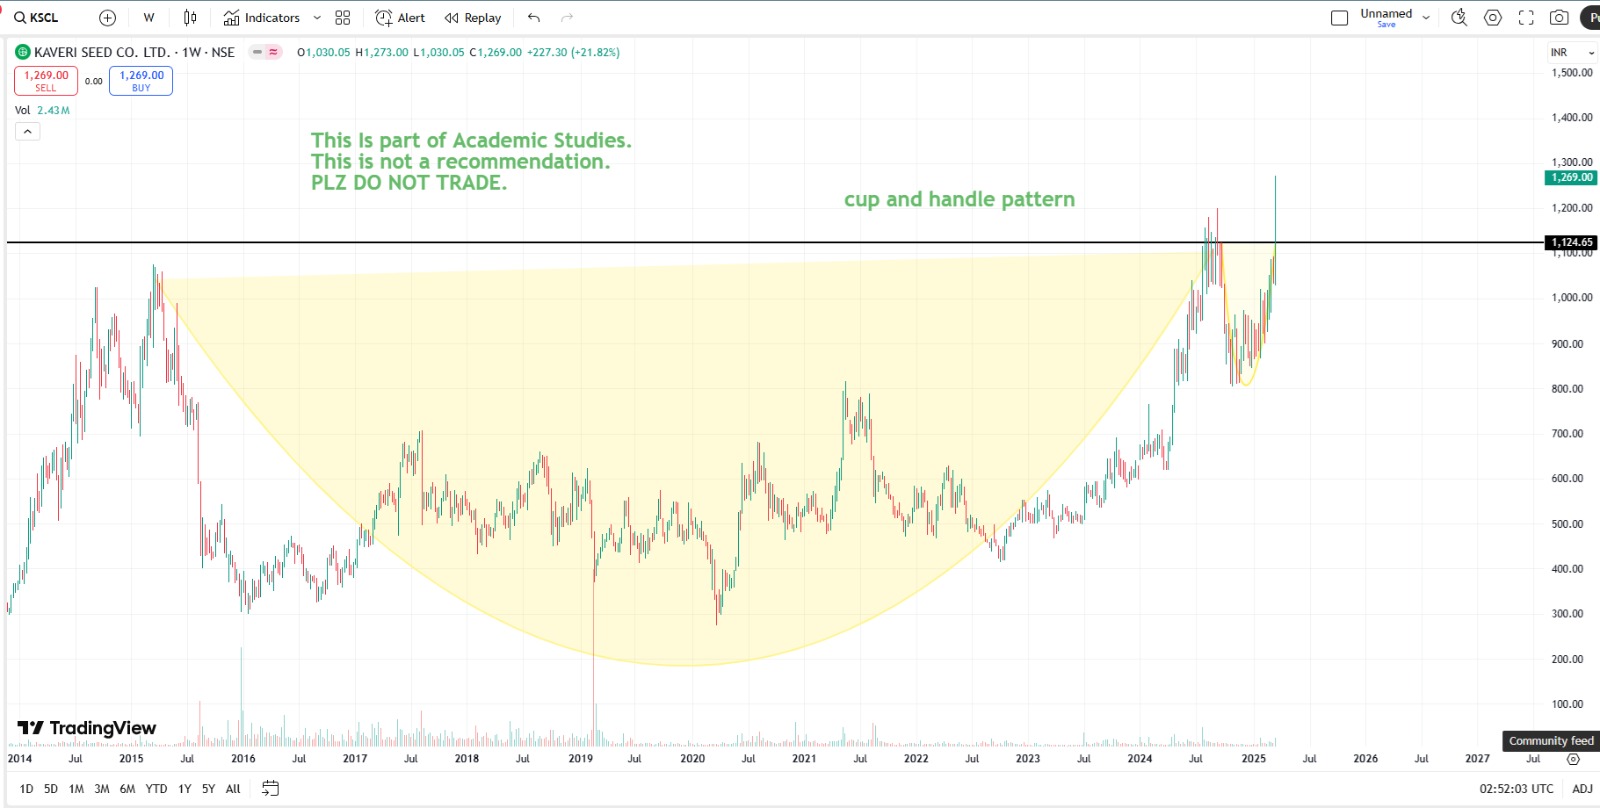
Breakout patterns like cup & handle, flag, pennant, ascending triangle
Reversal patterns like double bottom, inverse head & shoulders
Range-bound stocks that are oscillating between support and resistance
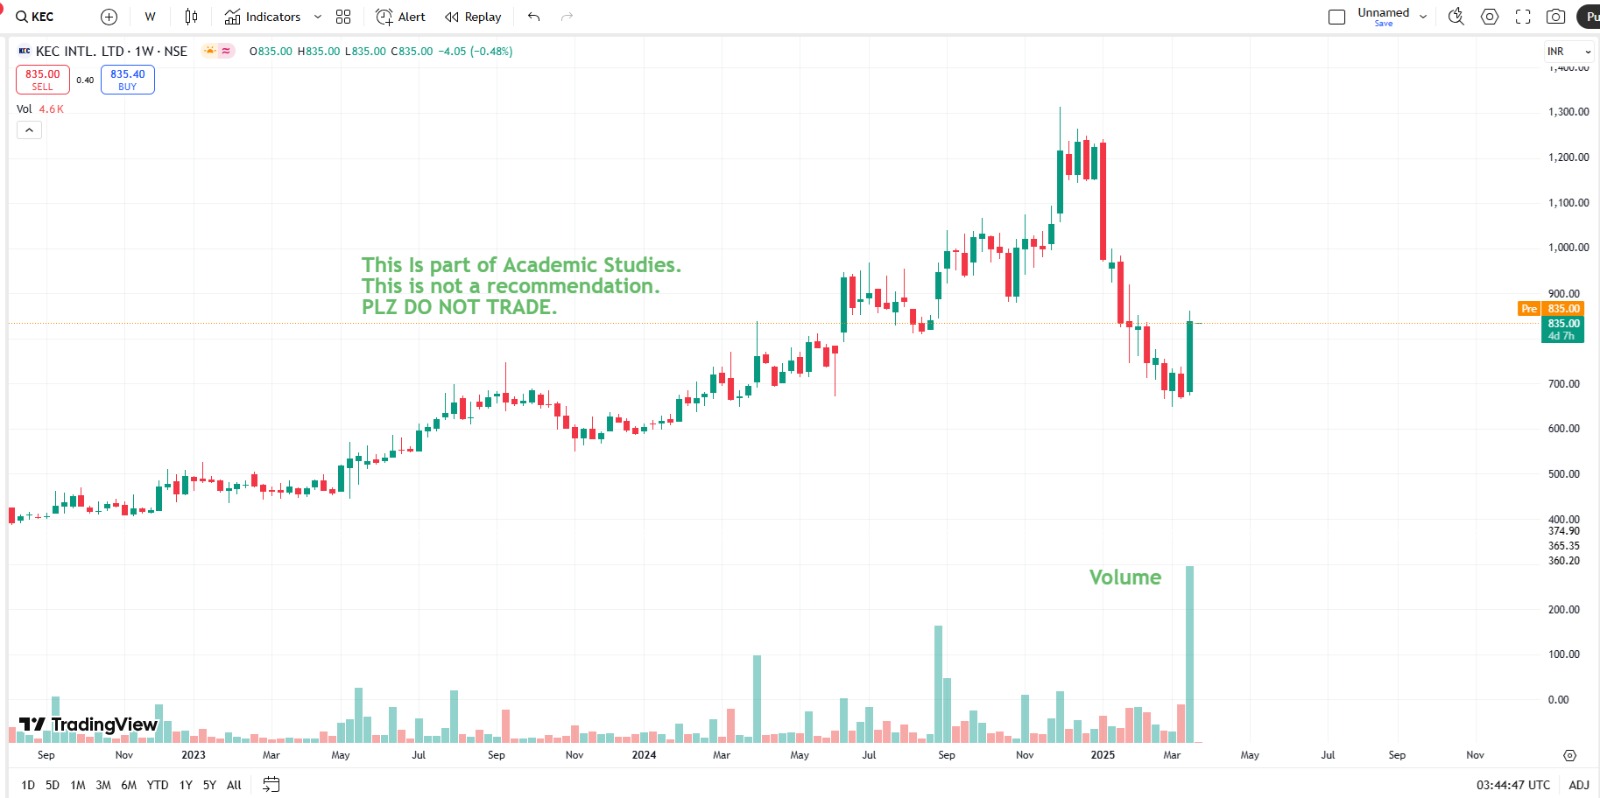
If volume confirms the pattern, it signals that big players (institutions, HNIs, FIIs, etc.) are involved.
2️⃣ Conduct Fundamental Analysis
Understand the business model and competitive edge
Analyze financials (Revenue growth, Profitability, Debt levels, etc.)
Evaluate management quality and future plans
Check valuations (P/E ratio, P/B ratio, PEG, etc.) to avoid overvalued stocks
3️⃣ Create a Watchlist & Monitor Price Action
Track these stocks daily or weekly
Observe price & volume movements—Is the price stable, or is it a fake breakout?
Stay updated on news and sectoral trends—Are there any external triggers?
4️⃣ Find the Right Entry
If it’s a breakout, wait for a retest
If it’s a reversal, wait for confirmation
Follow risk management—set a stop-loss and define position sizing
Example:
Let’s say an FMCG stock gives a strong breakout with high volume, has a consistent ROE of 20%+, is debt-free, and has strong demand. Instead of chasing it immediately, it’s smarter to add it to your watchlist and monitor price action. Waiting for a retest or a dip before entering is a better approach than buying out of FOMO.
Conclusion:
Combining pattern & volume analysis with fundamentals is a smart approach. This helps in executing high-conviction trades while minimizing risk. Just stay patient and disciplined until the best opportunity presents itself!