

📊 Stock Volume Analysis
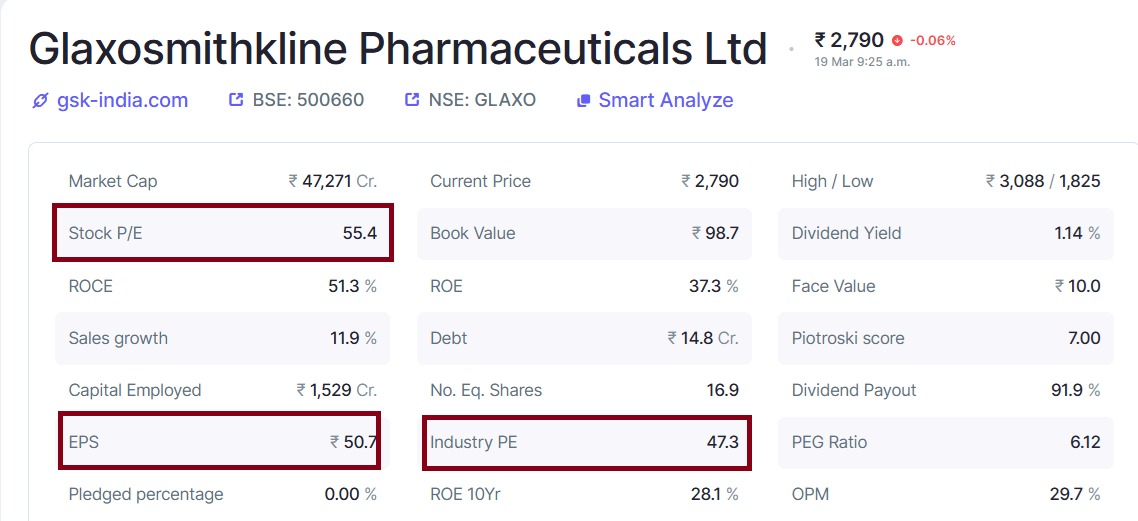
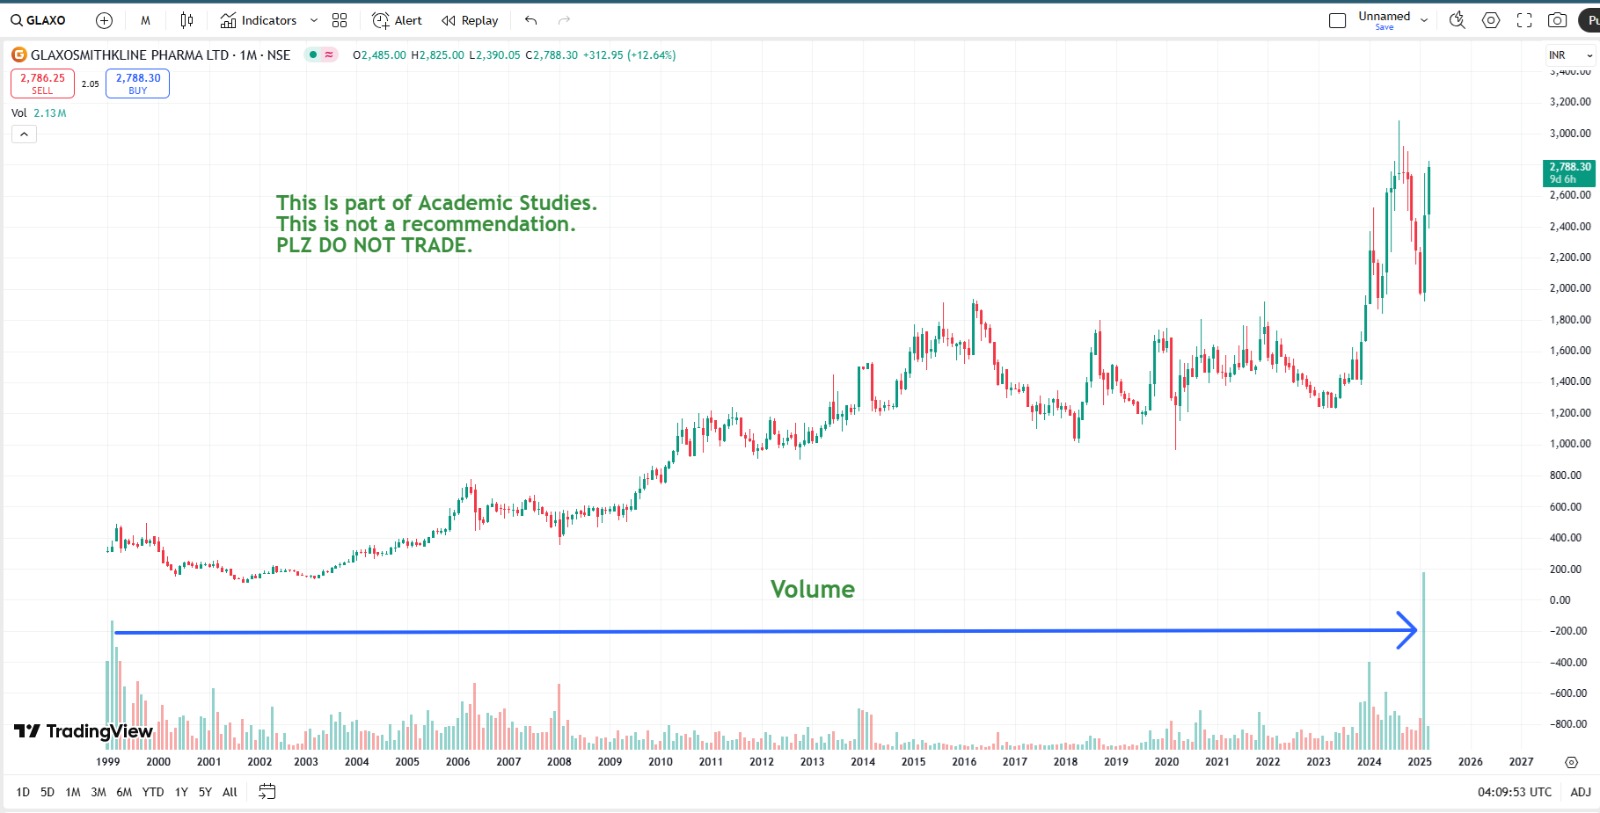
The company has a market cap of ₹47,271 Cr and is debt-free, indicating a strong financial position. Last month, the monthly chart recorded historically high volumes, a sign of strong market activity.
However, a negative signal is observed – a large wick on the upper side of the candle, suggesting that when the price went up, sellers aggressively sold, overpowering buyers.
This pattern is commonly seen when a stock reaches a strong resistance level, leading to increased selling pressure.
💰 Revenue Growth – A Major Concern
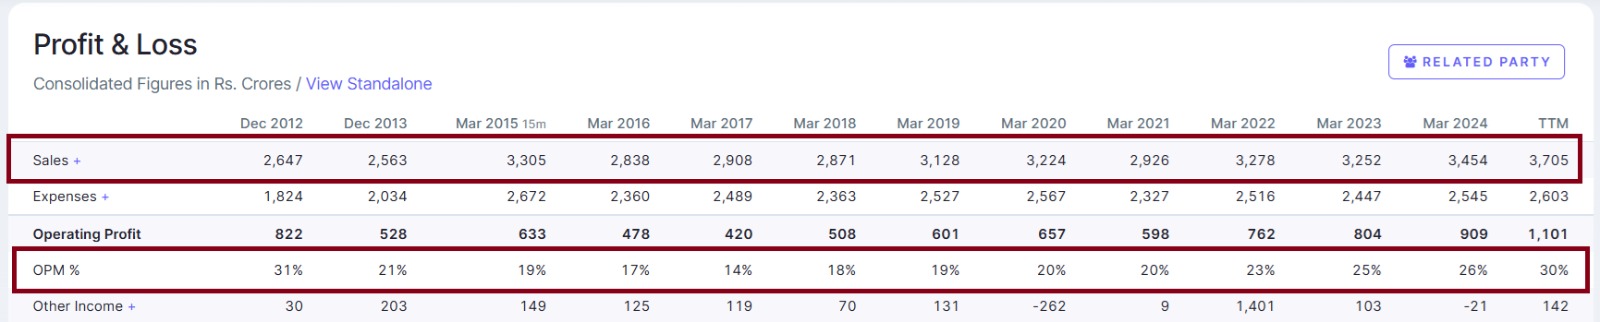
The company’s revenue growth has been stagnant, which is a significant concern.
In March 2012, the revenue was ₹2,647 Cr, and by March 2024, it reached only ₹3,454 Cr.
This means only a 30% growth in 12 years – and if adjusted for inflation, the real growth is almost zero!
No major expansion has been observed, which could be a negative sign for future growth.
📉 Margins are Declining
Operating margin is shrinking:
March 2012: 31%
March 2024: 26%
Declining margins indicate:
Rising cost pressures
Loss of pricing power
Increased competition, where new players are entering the market, and GSK is unable to maintain its monopoly.
🏦 Reserves Are Depleting
The company’s reserves are consistently decreasing:
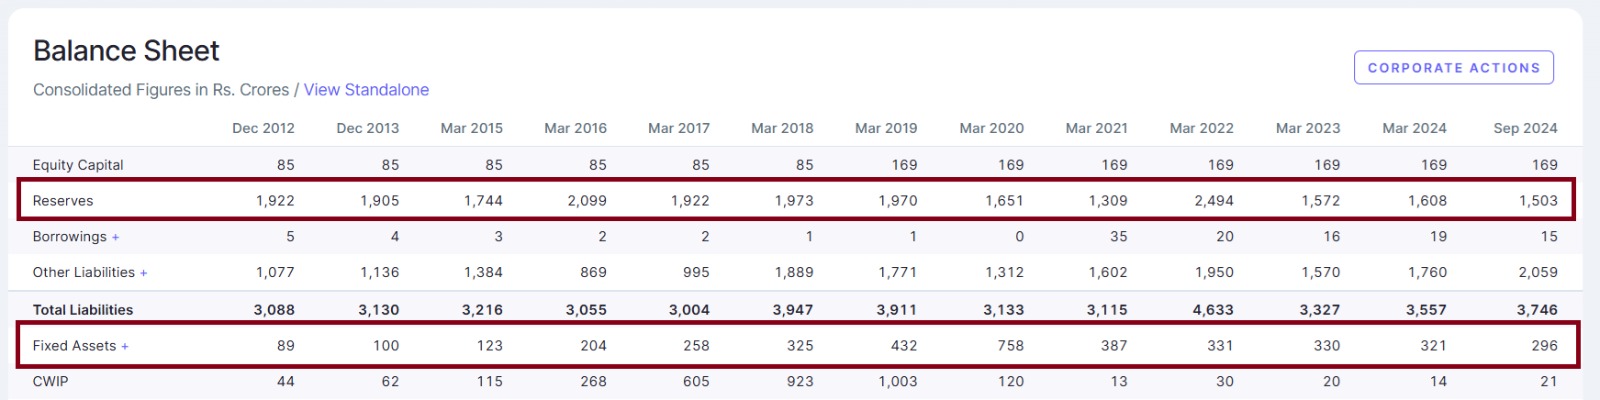
March 2013: ₹1,922 Cr
March 2024: ₹1,503 Cr
Falling reserves indicate that:
The company is not retaining enough profits.
It is possibly making heavy payouts without reinvesting in the business.
In the long run, this could be risky if the company does not focus on expansion and innovation.
🏗 Why is There No Capex?
The company is not investing in capital expenditure (Capex), meaning:
No new plants
No R&D facilities
No investment in new product lines
Without significant investments, how will the company grow?
A stagnant business is a long-term risk for investors, as its market share may gradually decline.
Final Verdict – What’s the Future of the Stock?
✅ Positives:
✔ Debt-free company with a strong financial position.
✔ Good market capitalization, meaning no liquidity issues.
❌ Concerns:
🚨 Revenue growth is stagnant.
🚨 Operating margins are shrinking.
🚨 Reserves are depleting.
🚨 No Capex, which limits future growth potential.
⚠ Technical Red Flag:
The large wick candle suggests that sellers still dominate the stock.
If the price fails to break the resistance, further correction is possible.
Since 2012, similar chart patterns have led to selling pressure, and stocks with this pattern have often declined.
Conclusion:
📉 GSK Pharma is a fundamentally strong but stagnant company.
📊 Lack of growth, shrinking margins, and no Capex indicate that the stock might not generate strong returns in the near future.
⚠ If the resistance is not broken, the stock could see further corrections.
🔍 Investors should carefully assess whether they want to hold a company with limited growth potential.


